Private School

Ipswich High School
- 4.7 (10 reviews)
- All-through
- Woolverstone IP9 1AZ
1 schools in compare list
ISI Report
Notify us of new ISI report
Quick insights from ISI Powered by AI
This insight was generated by AI, based on latest ISI report.
Academic Progress: GCSE performance above national average; A-levels in line nationally
Behaviour and Attitudes: Principles and values foster responsible citizenship
Support for Pupils Falling Behind: Additional support for SEND and EAL pupils
Impact of Teaching on Student Progress: Teaching enables good progress with effective behavior management
Communication with Parents: Provision of information includes child's progress report
Actions to Enhance Education Quality: Leadership ensures consistent meeting of standards, promoting well-being
Managing Bullying and Ensuring Safety: Safeguarding measures in place meet statutory guidance
Promoting Pupils' Welfare and Safety: Strategic approach to risk assessment
Outdoor Facilities: Adequate outdoor space for physical education and play
Support for SEND: Specialist help provided for identified SEND pupils
Historical ISI reports
Contact
About Us
Ipswich High School is a All-through, Co-Ed school located in Suffolk, East of England.
It has 520 students from age 3-19 yr.
Tuition fee £2,266 to £5,985 for the highest grade offered.
At this school, 0% of pupils achieved grade 5 or more at GCSE.
Distance calculator
Simply click on 'Detect My Location' to find out the distance from your current location to the school.
Ipswich High School
Nearby Schools in Your Area
From the Ipswich High School
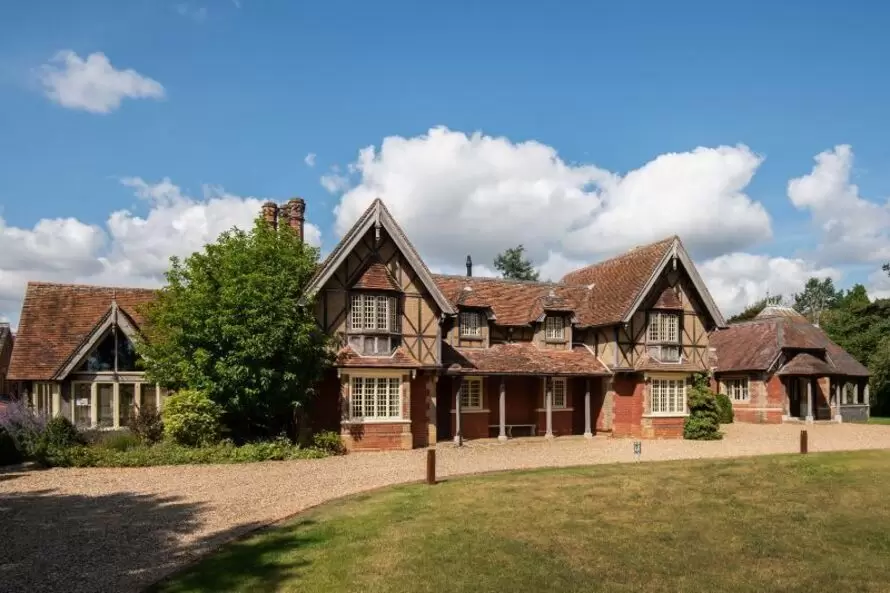
Ipswich High School is a vibrant day and boarding school for boys and girls aged 3-18, set in an idyllic 87-acre campus in Woolverstone on the banks of the River Orwell.
With approximately 500 pupils, we are a small school with amazing facilities. We have small classes of hard-working pupils and inspirational teachers who help to instil a love of learning, the results of which are exceptional academic outcomes year on year.
At Ipswich High School, we understand that the world today requires young people to be so much more than simply good at passing exams. Our vision is to prepare our pupils to thrive in the 21st Century by providing them with the educational foundations to flourish.
Gallery


Secondary Exam Result
Discover school's performance with the Attainment 8 and Progress 8 scores. Attainment 8 reflects pupil achievement in 8 qualifications, while Progress 8 measures their progress from key stage 2 to 4, compared to peers across England.
| School scores | School | Description |
|---|---|---|
| Progress 8 score | - | This score shows how much progress pupils at this school made across 8 qualifications between the end of key stage 2 and the end of key stage 4. |
| Attainment 8 score | 44.5 | Schools get a score based on how well pupils have performed in up to 8 qualifications. |
Explore the percentage of pupils who attained grade 5 or higher & grade 4 or higher in their English and math GCSEs. This metric reflects their proficiency in these fundamental subjects.
| GCSE Results | School | LA | England |
|---|---|---|---|
| Grade 5 or above in English & Maths GCSEs | 0% | 27.21% | 30.03% |
| Grade 4 or above in English & Maths GCSEs | 0% | 41.83% | 43.07% |
The English Baccalaureate (EBacc) ensures your child's well-rounded education. It includes essential subjects like English, math, sciences, languages, and humanities.
| EBacc Results | School | LA | England |
|---|---|---|---|
| Entering EBacc | 0% | 18.17% | 25.06% |
| Achieving the EBacc at grade 5 or above | 0% | 7.12% | 10.91% |
| Achieving the EBacc at grade 4 or above | 0% | 10.69% | 15.51% |
| EBacc average points score | 3.38 | 2.77 | 2.83 |
Find out where our Key Stage 4 graduates are going next. Explore their different paths after finishing school – whether it's sixth form, starting work, or other adventures as they move forward.
| Pupil destinations | School | LA | England |
|---|---|---|---|
| Pupils staying in education or employment | - | 88.49% | 90.53% |
| Total number of pupils included in destination measures | - | 140 | 144 |
| Pupils staying in education | - | 81.35% | 84.16% |
| Further education college or other further education provider | - | 38.96% | 32.73% |
| School sixth forms | - | 32.35% | 29.8% |
| Sixth form colleges | - | 4.88% | 10.22% |
| Other education destinations | - | 5.24% | 11.43% |
| Pupils in apprenticeships | - | 3.37% | 2.8% |
| Pupils staying in employment | - | 3.76% | 3.59% |
Discover school's performance with the Attainment 8 and Progress 8 scores. Attainment 8 reflects pupil achievement in 8 qualifications, while Progress 8 measures their progress from key stage 2 to 4, compared to peers across England.
| School scores | School | Description |
|---|---|---|
| Progress 8 score | - | This score shows how much progress pupils at this school made across 8 qualifications between the end of key stage 2 and the end of key stage 4. |
| Attainment 8 score | 46.6 | Schools get a score based on how well pupils have performed in up to 8 qualifications. |
Explore the percentage of pupils who attained grade 5 or higher & grade 4 or higher in their English and math GCSEs. This metric reflects their proficiency in these fundamental subjects.
| GCSE Results | School | LA | England |
|---|---|---|---|
| Grade 5 or above in English & Maths GCSEs | 1% | 27.91% | 32.85% |
| Grade 4 or above in English & Maths GCSEs | 1% | 41.74% | 45.33% |
The English Baccalaureate (EBacc) ensures your child's well-rounded education. It includes essential subjects like English, math, sciences, languages, and humanities.
| EBacc Results | School | LA | England |
|---|---|---|---|
| Entering EBacc | 0% | 16.55% | 24.94% |
| Achieving the EBacc at grade 5 or above | 0% | 8.38% | 13.02% |
| Achieving the EBacc at grade 4 or above | 0% | 11.29% | 17.19% |
| EBacc average points score | 3.4 | 2.84 | 2.97 |
Find out where our Key Stage 4 graduates are going next. Explore their different paths after finishing school – whether it's sixth form, starting work, or other adventures as they move forward.
| Pupil destinations | School | LA | England |
|---|---|---|---|
| Pupils staying in education or employment | - | 91.24% | 90.4% |
| Total number of pupils included in destination measures | - | 139 | 141 |
| Pupils staying in education | - | 86.3% | 86.29% |
| Further education college or other further education provider | - | 39.28% | 34.03% |
| School sixth forms | - | 35.58% | 30.82% |
| Sixth form colleges | - | 4.88% | 10.38% |
| Other education destinations | - | 6.44% | 11.08% |
| Pupils in apprenticeships | - | 2.52% | 1.99% |
| Pupils staying in employment | - | 2.46% | 2.13% |
Exam Result Not Published
Due to the pandemic, 2020 and 2021 Secondary school exam
results were not published at school level.
Exam Result Not Published
Due to the pandemic, 2020 and 2021 Secondary school exam
results were not published at school level.
Discover school's performance with the Attainment 8 and Progress 8 scores. Attainment 8 reflects pupil achievement in 8 qualifications, while Progress 8 measures their progress from key stage 2 to 4, compared to peers across England.
| School scores | School | Description |
|---|---|---|
| Progress 8 score | - | This score shows how much progress pupils at this school made across 8 qualifications between the end of key stage 2 and the end of key stage 4. |
| Attainment 8 score | 50.5 | Schools get a score based on how well pupils have performed in up to 8 qualifications. |
Explore the percentage of pupils who attained grade 5 or higher & grade 4 or higher in their English and math GCSEs. This metric reflects their proficiency in these fundamental subjects.
| GCSE Results | School | LA | England |
|---|---|---|---|
| Grade 5 or above in English & Maths GCSEs | 0% | 26.24% | 29.3% |
| Grade 4 or above in English & Maths GCSEs | 0% | 42.5% | 43.41% |
The English Baccalaureate (EBacc) ensures your child's well-rounded education. It includes essential subjects like English, math, sciences, languages, and humanities.
| EBacc Results | School | LA | England |
|---|---|---|---|
| Entering EBacc | 0% | 24.5% | 25.8% |
| Achieving the EBacc at grade 5 or above | 0% | 9.22% | 11.47% |
| Achieving the EBacc at grade 4 or above | 0% | 14.43% | 16.49% |
| EBacc average points score | 3.75 | 3.05 | 2.88 |
Find out where our Key Stage 4 graduates are going next. Explore their different paths after finishing school – whether it's sixth form, starting work, or other adventures as they move forward.
| Pupil destinations | School | LA | England |
|---|---|---|---|
| Pupils staying in education or employment | - | 93.32% | 90.2% |
| Total number of pupils included in destination measures | - | 137 | 135 |
| Pupils staying in education | - | 85.48% | 84.08% |
| Further education college or other further education provider | - | 36.73% | 33.25% |
| School sixth forms | - | 37.89% | 31.27% |
| Sixth form colleges | - | 8.27% | 8.45% |
| Other education destinations | - | 2.66% | 11.14% |
| Pupils in apprenticeships | - | 4.59% | 3.4% |
| Pupils staying in employment | - | 3.27% | 2.75% |
Discover school's performance with the Attainment 8 and Progress 8 scores. Attainment 8 reflects pupil achievement in 8 qualifications, while Progress 8 measures their progress from key stage 2 to 4, compared to peers across England.
| School scores | School | Description |
|---|---|---|
| Progress 8 score | - | This score shows how much progress pupils at this school made across 8 qualifications between the end of key stage 2 and the end of key stage 4. |
| Attainment 8 score | 51.1 | Schools get a score based on how well pupils have performed in up to 8 qualifications. |
Explore the percentage of pupils who attained grade 5 or higher & grade 4 or higher in their English and math GCSEs. This metric reflects their proficiency in these fundamental subjects.
| GCSE Results | School | LA | England |
|---|---|---|---|
| Grade 5 or above in English & Maths GCSEs | 0% | 27.79% | 29.22% |
| Grade 4 or above in English & Maths GCSEs | 0% | 43.5% | 42.62% |
The English Baccalaureate (EBacc) ensures your child's well-rounded education. It includes essential subjects like English, math, sciences, languages, and humanities.
| EBacc Results | School | LA | England |
|---|---|---|---|
| Entering EBacc | 0% | 21.2% | 24.73% |
| Achieving the EBacc at grade 5 or above | 0% | 7.92% | 11.33% |
| Achieving the EBacc at grade 4 or above | 0% | 12.59% | 16.01% |
| EBacc average points score | 3.93 | 3.05 | 2.84 |
Find out where our Key Stage 4 graduates are going next. Explore their different paths after finishing school – whether it's sixth form, starting work, or other adventures as they move forward.
| Pupil destinations | School | LA | England |
|---|---|---|---|
| Pupils staying in education or employment | - | 88.36% | 84.87% |
| Total number of pupils included in destination measures | - | 148 | 140 |
| Pupils staying in education | - | 77.17% | 73.88% |
| Further education college or other further education provider | - | 33.1% | 28.31% |
| School sixth forms | - | 37.07% | 31.6% |
| Sixth form colleges | - | 5.86% | 9.08% |
| Other education destinations | - | 1.43% | 5.87% |
| Pupils in apprenticeships | - | 4.88% | 2.96% |
| Pupils staying in employment | - | 2.98% | 2.05% |
Discover school's performance with the Attainment 8 and Progress 8 scores. Attainment 8 reflects pupil achievement in 8 qualifications, while Progress 8 measures their progress from key stage 2 to 4, compared to peers across England.
| School scores | School | Description |
|---|---|---|
| Progress 8 score | - | This score shows how much progress pupils at this school made across 8 qualifications between the end of key stage 2 and the end of key stage 4. |
| Attainment 8 score | 40.5 | Schools get a score based on how well pupils have performed in up to 8 qualifications. |
Explore the percentage of pupils who attained grade 5 or higher & grade 4 or higher in their English and math GCSEs. This metric reflects their proficiency in these fundamental subjects.
| GCSE Results | School | LA | England |
|---|---|---|---|
| Grade 5 or above in English & Maths GCSEs | 0% | 27.84% | 29.55% |
| Grade 4 or above in English & Maths GCSEs | 0% | 43.98% | 43.07% |
The English Baccalaureate (EBacc) ensures your child's well-rounded education. It includes essential subjects like English, math, sciences, languages, and humanities.
| EBacc Results | School | LA | England |
|---|---|---|---|
| Entering EBacc | 0% | 21.47% | 25.25% |
| Achieving the EBacc at grade 5 or above | 0% | 10.55% | 14.71% |
| Achieving the EBacc at grade 4 or above | 0% | 11.63% | 16.26% |
| EBacc average points score | - | - | - |
Find out where our Key Stage 4 graduates are going next. Explore their different paths after finishing school – whether it's sixth form, starting work, or other adventures as they move forward.
| Pupil destinations | School | LA | England |
|---|---|---|---|
| Pupils staying in education or employment | - | 89.82% | 85.29% |
| Total number of pupils included in destination measures | - | 161 | 145 |
| Pupils staying in education | - | 66.32% | 58.19% |
| Further education college or other further education provider | - | 37.55% | 30.58% |
| School sixth forms | - | 37.5% | 32.22% |
| Sixth form colleges | - | 6.66% | 8.95% |
| Other education destinations | - | 1.45% | 5.7% |
| Pupils in apprenticeships | - | 6.68% | 4.78% |
| Pupils staying in employment | - | 3.39% | 2.45% |
A level exam result
Explore their results and progress scores, showing how they've grown and achieved during this important stage of their education.
| A level Result | School | LA | England |
|---|---|---|---|
| Average points | 42.53 | 27.91 | 30.01 |
| Average grade | B+ | - | - |
| Average points (Best 3) | 42.35 | 28.39 | 29.57 |
| Average Grade (Best 3) | B+ | - | - |
| AAB or higher | 35.30% | 11.94% | 13.67% |
Discover where pupils headed after A-levels. Explore who either stayed in education or went into employment.
| Students destinations | School | LA | England |
|---|---|---|---|
| Number of students | - | 240 | 201 |
| Students staying in education | - | 49.86% | 58.58% |
| Students entering apprenticeships | - | 8.05% | 6.08% |
| Students entering employment | - | 28.95% | 21.16% |
| Students not in education or employment for at least two terms after study | - | 10.09% | 9.05% |
Explore their results and progress scores, showing how they've grown and achieved during this important stage of their education.
| A level Result | School | LA | England |
|---|---|---|---|
| Average points | 39.06 | 29.83 | 33.41 |
| Average grade | B | - | - |
| Average points (Best 3) | 39.87 | 29.21 | 32.47 |
| Average Grade (Best 3) | B | - | - |
| AAB or higher | 16.0% | 14.39% | 17.7% |
Discover where pupils headed after A-levels. Explore who either stayed in education or went into employment.
| Students destinations | School | LA | England |
|---|---|---|---|
| Number of students | - | 314 | 248 |
| Students staying in education | - | 53.1% | 60.67% |
| Students entering apprenticeships | - | 5.86% | 5% |
| Students entering employment | - | 27.33% | 17.73% |
| Students not in education or employment for at least two terms after study | - | 10.14% | 10.69% |
Exam Result Not Published
Due to the pandemic, 2020 and 2021 A level school exam
results were not published at school level.
Exam Result Not Published
Due to the pandemic, 2020 and 2021 A level school exam
results were not published at school level.
Explore their results and progress scores, showing how they've grown and achieved during this important stage of their education.
| A level Result | School | LA | England |
|---|---|---|---|
| Average points | 39.92 7 | 27.68 | 29.39 |
| Average grade | B | - | - |
| Average points (Best 3) | 39.30 8 | 28.27 | 28.64 |
| Average Grade (Best 3) | B | - | - |
| AAB or higher | 21.1% | 11.89% | 13.07% |
Discover where pupils headed after A-levels. Explore who either stayed in education or went into employment.
| Students destinations | School | LA | England |
|---|---|---|---|
| Number of students | - | 278 | 232 |
| Students staying in education | - | 51.19% | 57.31% |
| Students entering apprenticeships | - | 8.33% | 7.77% |
| Students entering employment | - | 29% | 20.99% |
| Students not in education or employment for at least two terms after study | - | 7.9% | 8.8% |
Explore their results and progress scores, showing how they've grown and achieved during this important stage of their education.
| A level Result | School | LA | England |
|---|---|---|---|
| Average points | 32.03 8 | 27.91 | 29.03 |
| Average grade | C+ | - | - |
| Average points (Best 3) | 31.82 8 | 27.94 | 28.82 |
| Average Grade (Best 3) | C+ | - | - |
| AAB or higher | 9.1% | 11.35% | 13.37% |
Discover where pupils headed after A-levels. Explore who either stayed in education or went into employment.
| Students destinations | School | LA | England |
|---|---|---|---|
| Number of students | - | 4 | 3 |
| Students staying in education | - | 49.05% | 31.5% |
| Students entering apprenticeships | - | 6.81% | 5.54% |
| Students entering employment | - | 23.19% | 15.81% |
| Students not in education or employment for at least two terms after study | - | 3.43% | 4.22% |
Explore their results and progress scores, showing how they've grown and achieved during this important stage of their education.
| A level Result | School | LA | England |
|---|---|---|---|
| Average points | 40.05 | 26.76 | 26.73 |
| Average grade | B | - | - |
| Average points (Best 3) | 39.54 | 27.01 | 27.73 |
| Average Grade (Best 3) | B | - | - |
| AAB or higher | 41.4% | 11.18% | 12.64% |
Discover where pupils headed after A-levels. Explore who either stayed in education or went into employment.
| Students destinations | School | LA | England |
|---|---|---|---|
| Number of students | - | 3 | 3 |
| Students staying in education | - | 46.42% | 36.26% |
| Students entering apprenticeships | - | 9.04% | 6.37% |
| Students entering employment | - | 26.46% | 20.03% |
| Students not in education or employment for at least two terms after study | - | 3.25% | 4.23% |
How Do We Calculate Rankings?
Our school rankings are meticulously determined through a rigorous process:
This meticulous process ensures our rankings provide accurate and meaningful insights for your school choices.
Admission and Fees
Admission
Fees
| Program | Age | Fee |
|---|---|---|
| Day fees Years 7 & 8 | 11-13 yr | £21,918 (Year) |
Scholarships
Holidays & terms
Holidays 2024/25
| Holidays | Date |
|---|---|
| Autumn Half Term Holidays | 20th Oct 2025 - 31st Oct 2025 |
| Winter Holidays | 17th Dec 2025 - 5th Jan 2026 |
| Spring Half Term Holidays | 16th Feb 2026 - 20th Feb 2026 |
| Spring Holidays | 27th Mar 2026 - 20th Apr 2026 |
| Summer Half Term Holidays | 25th May 2026 - 29th May 2026 |
| Summer Holidays | 7th Jul 2025 - 3rd Sep 2026 |
Terms Dates 2024/25
| Terms | Dates |
|---|---|
| Autumn Term | 2nd Sep 2024 - 27th Oct 2024 |
| Autumn Term-2 | 2nd Nov 2024 - 22nd Dec 2024 |
| Spring Term | 4th Jan 2025 - 16th Feb 2025 |
| Spring Term-2 | 22nd Feb 2025 - 6th Apr 2025 |
| Summer Term | 22nd Apr 2025 - 25th May 2025 |
| Summer Term-2 | 31st May 2025 - 22nd Jul 2025 |
Students Teachers