Private School

Reddam House Berkshire
- All-through
- Arborfield and Newland RG41 5BG
1 schools in compare list
ISI Report
Notify us of new ISI report
Quick insights from ISI Powered by AI
This insight was generated by AI, based on latest ISI report.
Academic Progress: Pupils make excellent progress with high GCSE and A-level results
Behaviour and Attitudes: Pupils show outstanding behaviour and attitudes with strong motivation
Support for Pupils Falling Behind: Dedicated staff and targeted support help pupils falling behind
Teacher Engagement: Teachers have high expectations and excellent subject knowledge
Impact of Teaching on Student Progress: Teaching enables good progress and pupil engagement
Strengths or Challenges with Teaching Staff: Strong subject knowledge helps achieve high attainment
Opportunities for Parent Involvement: Parents are involved through regular meetings and suggestions
Communication with Parents: Consistent communication keeps parents informed
Parent Satisfaction: Parents express high satisfaction in surveys
Handling Conflicts and Concerns: Leadership effectively addresses conflicts and student concerns
Actions to Enhance Education Quality: Continuous improvement in curriculum supports high standards
Managing Bullying and Ensuring Safety: Strong anti-bullying measures and pupil safety
Behaviour and Attitudes of Pupils: Pupils have exemplary behaviour and mutual respect
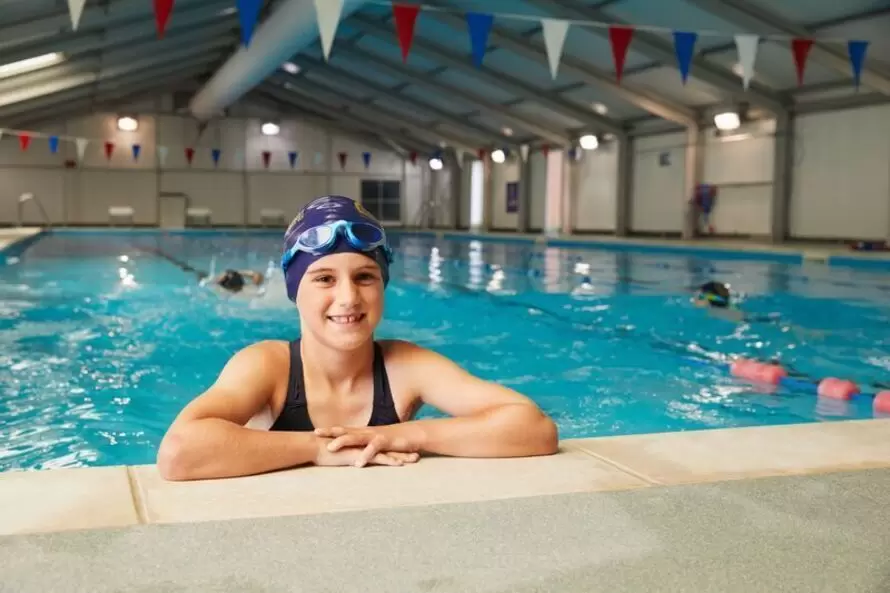
Extracurricular Activities & Clubs: Variety of activities enhances skills and abilities
Outdoor Facilities: Adequate outdoor space supports physical education
Career Counselling Services: Career counseling guidance available to students
Preparation for Next Key Stage: Students are well-prepared for future stages
Support for SEND: Excellent support for students with SEND ensures progress
Historical ISI reports
Contact
About Us
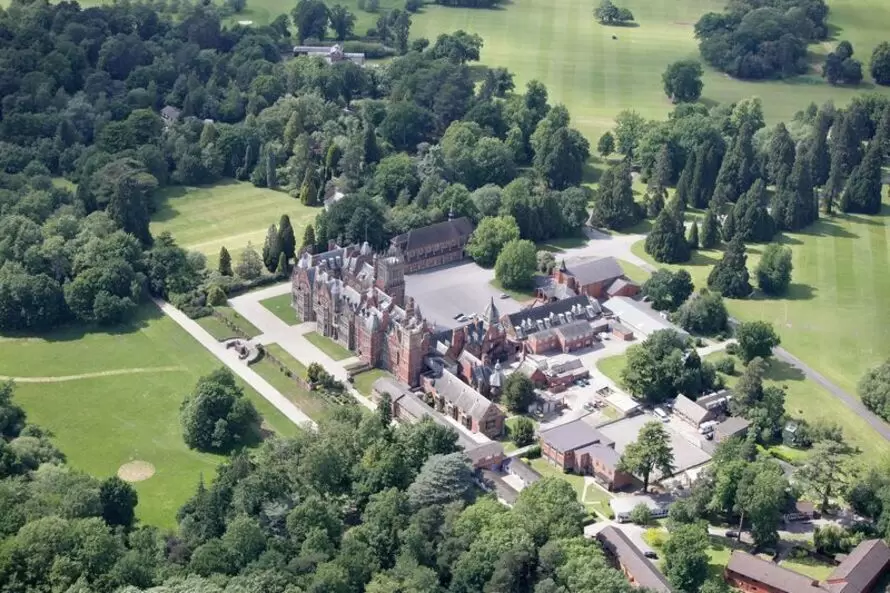
Reddam House Berkshire is a All-through, Co-Ed school located in Berkshire, South East.
It has 790 students from age 0-19 yr.
Tuition fee £1,672 to £6,961 for the highest grade offered.
At this school, 0% of pupils achieved grade 5 or more at GCSE.
Distance calculator
Simply click on 'Detect My Location' to find out the distance from your current location to the school.
Reddam House Berkshire
Nearby Schools in Your Area
From the Reddam House Berkshire
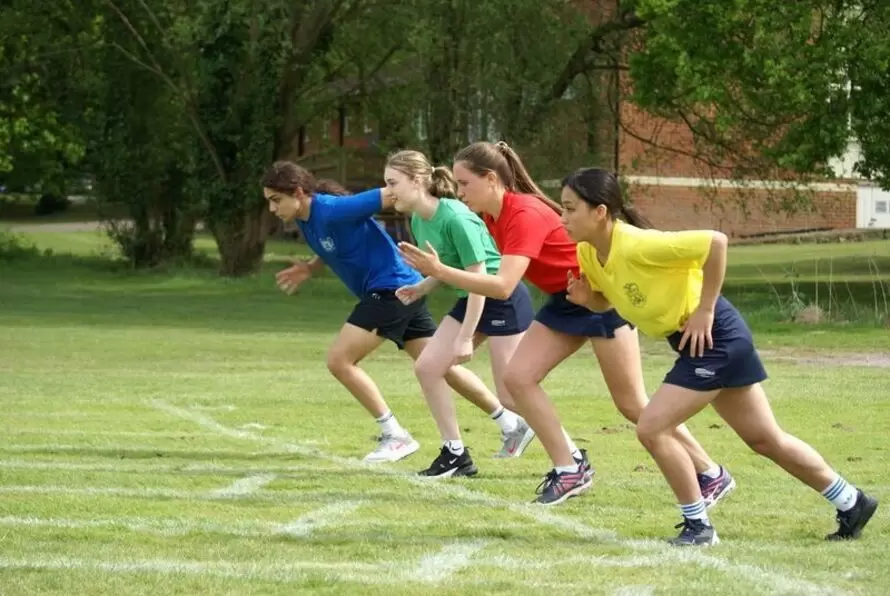
Reddam House provides outstanding private education for students from 3 months to 18 years of age. Our approach is unique, integrating a challenging, academic and enriching curriculum, alongside performing arts and sports programmes. This innovative environment is an ideal place for our students to discover new interests, develop core skills, and cultivate their individual talents.
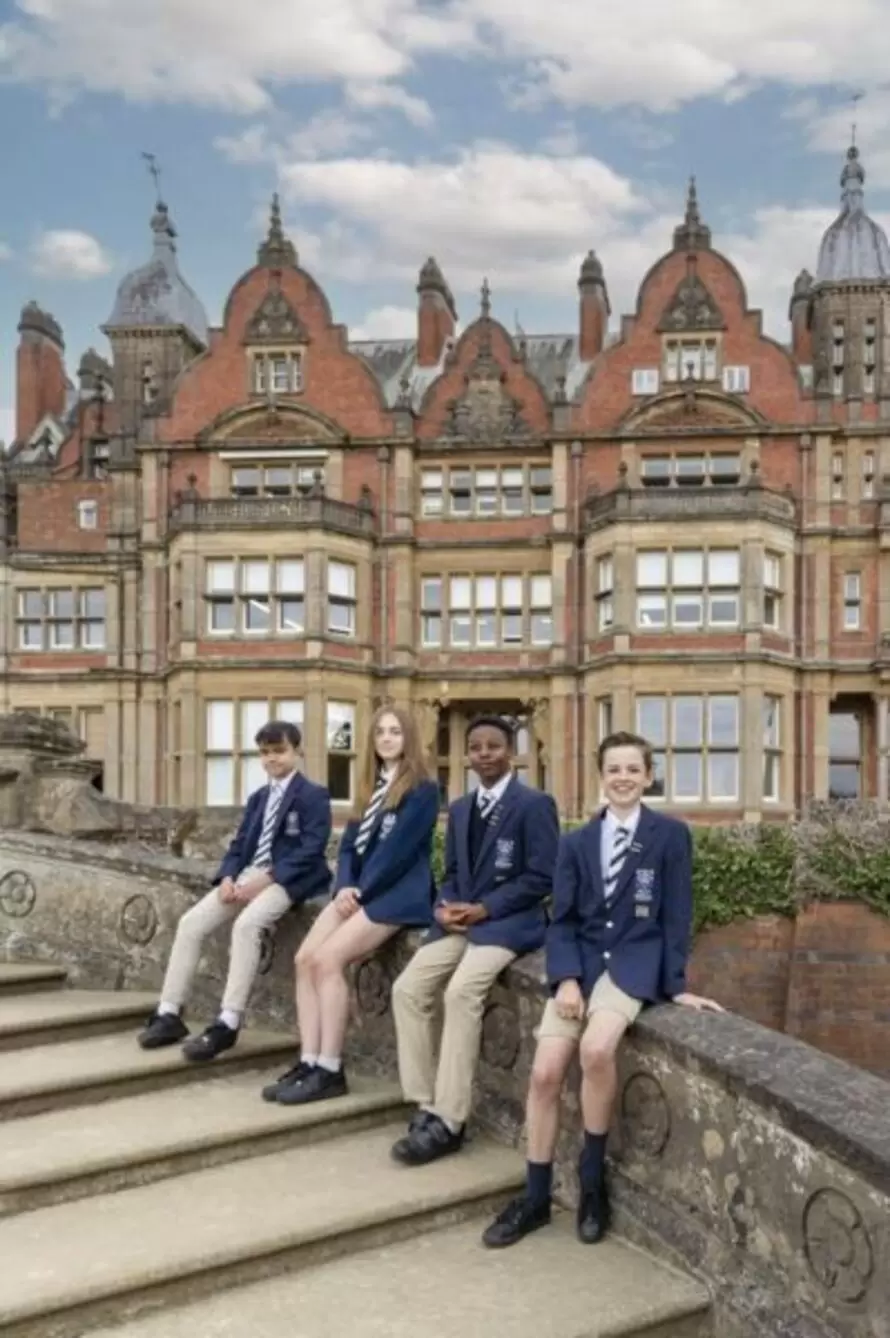
Our role is to equip students with the skills they need to thrive, and our focus is on developing a lifelong love of learning, no matter the stage of your child's education, or whether they are day or boarding students.
At our school, students become ready to face the future - with confidence, knowledge, and the skills to excel in their every endeavour.
Gallery


Compare with similar schools
| Phase of Education | All-through | All-through | All-through |
|---|---|---|---|
| Type | Independent Schools | Independent Schools | Independent Schools |
| ҹ�����о��� grade |
-
|
D-
|
-
|
| Ofset report | - | - | Good |
| Age range | 0-19 | 3-18 | 3-18 |


| Gender | Co-Ed | Co-Ed | Co-Ed |
|---|---|---|---|
| Student teacher ratio | - | - | - |
| Proficient Math | - | - | - |
| Proficient Read | - | - | - |
| Grade 5 or above GCSE | 0% | 0% | - |
| Grade 5 or above A Level | 31.60% | 10.50% | - |
| Day Fees | £1,672 to £6,961 | £1,895 to £7,765 | - |
Secondary Exam Result
Discover school's performance with the Attainment 8 and Progress 8 scores. Attainment 8 reflects pupil achievement in 8 qualifications, while Progress 8 measures their progress from key stage 2 to 4, compared to peers across England.
| School scores | School | Description |
|---|---|---|
| Progress 8 score | - | This score shows how much progress pupils at this school made across 8 qualifications between the end of key stage 2 and the end of key stage 4. |
| Attainment 8 score | 37.3 | Schools get a score based on how well pupils have performed in up to 8 qualifications. |
Explore the percentage of pupils who attained grade 5 or higher & grade 4 or higher in their English and math GCSEs. This metric reflects their proficiency in these fundamental subjects.
| GCSE Results | School | LA | England |
|---|---|---|---|
| Grade 5 or above in English & Maths GCSEs | 0% | 29.47% | 30.03% |
| Grade 4 or above in English & Maths GCSEs | 0% | 39.21% | 43.07% |
The English Baccalaureate (EBacc) ensures your child's well-rounded education. It includes essential subjects like English, math, sciences, languages, and humanities.
| EBacc Results | School | LA | England |
|---|---|---|---|
| Entering EBacc | 0% | 21.42% | 25.06% |
| Achieving the EBacc at grade 5 or above | 0% | 11.26% | 10.91% |
| Achieving the EBacc at grade 4 or above | 0% | 15.21% | 15.51% |
| EBacc average points score | 3.43 | 2.71 | 2.83 |
Find out where our Key Stage 4 graduates are going next. Explore their different paths after finishing school – whether it's sixth form, starting work, or other adventures as they move forward.
| Pupil destinations | School | LA | England |
|---|---|---|---|
| Pupils staying in education or employment | - | 96.6% | 90.53% |
| Total number of pupils included in destination measures | - | 161 | 144 |
| Pupils staying in education | - | 90.7% | 84.16% |
| Further education college or other further education provider | - | 28.7% | 32.73% |
| School sixth forms | - | 45.3% | 29.8% |
| Sixth form colleges | - | 13.3% | 10.22% |
| Other education destinations | - | 3.4% | 11.43% |
| Pupils in apprenticeships | - | 2.9% | 2.8% |
| Pupils staying in employment | - | 3% | 3.59% |
Discover school's performance with the Attainment 8 and Progress 8 scores. Attainment 8 reflects pupil achievement in 8 qualifications, while Progress 8 measures their progress from key stage 2 to 4, compared to peers across England.
| School scores | School | Description |
|---|---|---|
| Progress 8 score | - | This score shows how much progress pupils at this school made across 8 qualifications between the end of key stage 2 and the end of key stage 4. |
| Attainment 8 score | 37.7 | Schools get a score based on how well pupils have performed in up to 8 qualifications. |
Explore the percentage of pupils who attained grade 5 or higher & grade 4 or higher in their English and math GCSEs. This metric reflects their proficiency in these fundamental subjects.
| GCSE Results | School | LA | England |
|---|---|---|---|
| Grade 5 or above in English & Maths GCSEs | 0% | 33.12% | 32.85% |
| Grade 4 or above in English & Maths GCSEs | 0% | 43% | 45.33% |
The English Baccalaureate (EBacc) ensures your child's well-rounded education. It includes essential subjects like English, math, sciences, languages, and humanities.
| EBacc Results | School | LA | England |
|---|---|---|---|
| Entering EBacc | 0% | 25% | 24.94% |
| Achieving the EBacc at grade 5 or above | 0% | 14.94% | 13.02% |
| Achieving the EBacc at grade 4 or above | 0% | 19.76% | 17.19% |
| EBacc average points score | 3.49 | 3.18 | 2.97 |
Find out where our Key Stage 4 graduates are going next. Explore their different paths after finishing school – whether it's sixth form, starting work, or other adventures as they move forward.
| Pupil destinations | School | LA | England |
|---|---|---|---|
| Pupils staying in education or employment | - | 94.67% | 90.4% |
| Total number of pupils included in destination measures | - | 172 | 141 |
| Pupils staying in education | - | 90.89% | 86.29% |
| Further education college or other further education provider | - | 29.22% | 34.03% |
| School sixth forms | - | 47.78% | 30.82% |
| Sixth form colleges | - | 9.78% | 10.38% |
| Other education destinations | - | 4.44% | 11.08% |
| Pupils in apprenticeships | - | 2.22% | 1.99% |
| Pupils staying in employment | - | 1.67% | 2.13% |
Exam Result Not Published
Due to the pandemic, 2020 and 2021 Secondary school exam
results were not published at school level.
Exam Result Not Published
Due to the pandemic, 2020 and 2021 Secondary school exam
results were not published at school level.
Discover school's performance with the Attainment 8 and Progress 8 scores. Attainment 8 reflects pupil achievement in 8 qualifications, while Progress 8 measures their progress from key stage 2 to 4, compared to peers across England.
| School scores | School | Description |
|---|---|---|
| Progress 8 score | - | This score shows how much progress pupils at this school made across 8 qualifications between the end of key stage 2 and the end of key stage 4. |
| Attainment 8 score | 45.5 | Schools get a score based on how well pupils have performed in up to 8 qualifications. |
Explore the percentage of pupils who attained grade 5 or higher & grade 4 or higher in their English and math GCSEs. This metric reflects their proficiency in these fundamental subjects.
| GCSE Results | School | LA | England |
|---|---|---|---|
| Grade 5 or above in English & Maths GCSEs | 0% | 34.38% | 29.3% |
| Grade 4 or above in English & Maths GCSEs | 0% | 48.23% | 43.41% |
The English Baccalaureate (EBacc) ensures your child's well-rounded education. It includes essential subjects like English, math, sciences, languages, and humanities.
| EBacc Results | School | LA | England |
|---|---|---|---|
| Entering EBacc | 0% | 27.85% | 25.8% |
| Achieving the EBacc at grade 5 or above | 0% | 13.54% | 11.47% |
| Achieving the EBacc at grade 4 or above | 0% | 19.31% | 16.49% |
| EBacc average points score | 3.48 | 3.3 | 2.88 |
Find out where our Key Stage 4 graduates are going next. Explore their different paths after finishing school – whether it's sixth form, starting work, or other adventures as they move forward.
| Pupil destinations | School | LA | England |
|---|---|---|---|
| Pupils staying in education or employment | - | 97.5% | 90.2% |
| Total number of pupils included in destination measures | - | 163 | 135 |
| Pupils staying in education | - | 90.13% | 84.08% |
| Further education college or other further education provider | - | 32.25% | 33.25% |
| School sixth forms | - | 49.75% | 31.27% |
| Sixth form colleges | - | 3.5% | 8.45% |
| Other education destinations | - | 4.75% | 11.14% |
| Pupils in apprenticeships | - | 5.38% | 3.4% |
| Pupils staying in employment | - | 2.25% | 2.75% |
Discover school's performance with the Attainment 8 and Progress 8 scores. Attainment 8 reflects pupil achievement in 8 qualifications, while Progress 8 measures their progress from key stage 2 to 4, compared to peers across England.
| School scores | School | Description |
|---|---|---|
| Progress 8 score | - | This score shows how much progress pupils at this school made across 8 qualifications between the end of key stage 2 and the end of key stage 4. |
| Attainment 8 score | 49.4 | Schools get a score based on how well pupils have performed in up to 8 qualifications. |
Explore the percentage of pupils who attained grade 5 or higher & grade 4 or higher in their English and math GCSEs. This metric reflects their proficiency in these fundamental subjects.
| GCSE Results | School | LA | England |
|---|---|---|---|
| Grade 5 or above in English & Maths GCSEs | 0% | 33.67% | 29.22% |
| Grade 4 or above in English & Maths GCSEs | 0% | 46.67% | 42.62% |
The English Baccalaureate (EBacc) ensures your child's well-rounded education. It includes essential subjects like English, math, sciences, languages, and humanities.
| EBacc Results | School | LA | England |
|---|---|---|---|
| Entering EBacc | 0% | 25.25% | 24.73% |
| Achieving the EBacc at grade 5 or above | 0% | 14.25% | 11.33% |
| Achieving the EBacc at grade 4 or above | 0% | 19.5% | 16.01% |
| EBacc average points score | 4.48 | 3.37 | 2.84 |
Find out where our Key Stage 4 graduates are going next. Explore their different paths after finishing school – whether it's sixth form, starting work, or other adventures as they move forward.
| Pupil destinations | School | LA | England |
|---|---|---|---|
| Pupils staying in education or employment | - | 93.33% | 84.87% |
| Total number of pupils included in destination measures | - | 178 | 140 |
| Pupils staying in education | - | 74.67% | 73.88% |
| Further education college or other further education provider | - | 23% | 28.31% |
| School sixth forms | - | 51.33% | 31.6% |
| Sixth form colleges | - | 6.5% | 9.08% |
| Other education destinations | - | 4.83% | 5.87% |
| Pupils in apprenticeships | - | 4% | 2.96% |
| Pupils staying in employment | - | 1.67% | 2.05% |
Discover school's performance with the Attainment 8 and Progress 8 scores. Attainment 8 reflects pupil achievement in 8 qualifications, while Progress 8 measures their progress from key stage 2 to 4, compared to peers across England.
| School scores | School | Description |
|---|---|---|
| Progress 8 score | - | This score shows how much progress pupils at this school made across 8 qualifications between the end of key stage 2 and the end of key stage 4. |
| Attainment 8 score | 39.7 | Schools get a score based on how well pupils have performed in up to 8 qualifications. |
Explore the percentage of pupils who attained grade 5 or higher & grade 4 or higher in their English and math GCSEs. This metric reflects their proficiency in these fundamental subjects.
| GCSE Results | School | LA | England |
|---|---|---|---|
| Grade 5 or above in English & Maths GCSEs | 0% | 34% | 29.55% |
| Grade 4 or above in English & Maths GCSEs | 0% | 46.08% | 43.07% |
The English Baccalaureate (EBacc) ensures your child's well-rounded education. It includes essential subjects like English, math, sciences, languages, and humanities.
| EBacc Results | School | LA | England |
|---|---|---|---|
| Entering EBacc | 0% | 27% | 25.25% |
| Achieving the EBacc at grade 5 or above | 0% | 17.17% | 14.71% |
| Achieving the EBacc at grade 4 or above | 0% | 18.75% | 16.26% |
| EBacc average points score | - | - | - |
Find out where our Key Stage 4 graduates are going next. Explore their different paths after finishing school – whether it's sixth form, starting work, or other adventures as they move forward.
| Pupil destinations | School | LA | England |
|---|---|---|---|
| Pupils staying in education or employment | - | 97.67% | 85.29% |
| Total number of pupils included in destination measures | - | 180 | 145 |
| Pupils staying in education | - | 80.17% | 58.19% |
| Further education college or other further education provider | - | 29% | 30.58% |
| School sixth forms | - | 55% | 32.22% |
| Sixth form colleges | - | 3.67% | 8.95% |
| Other education destinations | - | 6% | 5.7% |
| Pupils in apprenticeships | - | 3.67% | 4.78% |
| Pupils staying in employment | - | 1.33% | 2.45% |
A level exam result
Explore their results and progress scores, showing how they've grown and achieved during this important stage of their education.
| A level Result | School | LA | England |
|---|---|---|---|
| Average points | 37.18 | 32.43 | 30.01 |
| Average grade | B- | - | - |
| Average points (Best 3) | 38.42 | 32.65 | 29.57 |
| Average Grade (Best 3) | B | - | - |
| AAB or higher | 31.60% | 15.41% | 13.67% |
Discover where pupils headed after A-levels. Explore who either stayed in education or went into employment.
| Students destinations | School | LA | England |
|---|---|---|---|
| Number of students | - | 117 | 201 |
| Students staying in education | - | 63% | 58.58% |
| Students entering apprenticeships | - | 4% | 6.08% |
| Students entering employment | - | 23.14% | 21.16% |
| Students not in education or employment for at least two terms after study | - | 5.57% | 9.05% |
Explore their results and progress scores, showing how they've grown and achieved during this important stage of their education.
| A level Result | School | LA | England |
|---|---|---|---|
| Average points | 39.31 | 39.79 | 33.41 |
| Average grade | B | - | - |
| Average points (Best 3) | 41.47 | 40.17 | 32.47 |
| Average Grade (Best 3) | B | - | - |
| AAB or higher | 28.0% | 20.73% | 17.7% |
Discover where pupils headed after A-levels. Explore who either stayed in education or went into employment.
| Students destinations | School | LA | England |
|---|---|---|---|
| Number of students | - | 120 | 248 |
| Students staying in education | - | 63.29% | 60.67% |
| Students entering apprenticeships | - | 4% | 5% |
| Students entering employment | - | 22.86% | 17.73% |
| Students not in education or employment for at least two terms after study | - | 5.71% | 10.69% |
Exam Result Not Published
Due to the pandemic, 2020 and 2021 A level school exam
results were not published at school level.
Exam Result Not Published
Due to the pandemic, 2020 and 2021 A level school exam
results were not published at school level.
Explore their results and progress scores, showing how they've grown and achieved during this important stage of their education.
| A level Result | School | LA | England |
|---|---|---|---|
| Average points | 36.49 1 | 34.23 | 29.39 |
| Average grade | B- | - | - |
| Average points (Best 3) | 38.33 | 34.33 | 28.64 |
| Average Grade (Best 3) | B- | - | - |
| AAB or higher | 22.2% | 14.01% | 13.07% |
Discover where pupils headed after A-levels. Explore who either stayed in education or went into employment.
| Students destinations | School | LA | England |
|---|---|---|---|
| Number of students | - | 125 | 232 |
| Students staying in education | - | 61.33% | 57.31% |
| Students entering apprenticeships | - | 7% | 7.77% |
| Students entering employment | - | 22.5% | 20.99% |
| Students not in education or employment for at least two terms after study | - | 6.17% | 8.8% |
Explore their results and progress scores, showing how they've grown and achieved during this important stage of their education.
| A level Result | School | LA | England |
|---|---|---|---|
| Average points | 37.23 7 | 34.73 | 29.03 |
| Average grade | B- | - | - |
| Average points (Best 3) | 38.60 9 | 34.95 | 28.82 |
| Average Grade (Best 3) | B | - | - |
| AAB or higher | 31.6% | 17.63% | 13.37% |
Discover where pupils headed after A-levels. Explore who either stayed in education or went into employment.
| Students destinations | School | LA | England |
|---|---|---|---|
| Number of students | - | 1 | 3 |
| Students staying in education | - | 30.4% | 31.5% |
| Students entering apprenticeships | - | 6.2% | 5.54% |
| Students entering employment | - | 24% | 15.81% |
| Students not in education or employment for at least two terms after study | - | 3.6% | 4.22% |
Explore their results and progress scores, showing how they've grown and achieved during this important stage of their education.
| A level Result | School | LA | England |
|---|---|---|---|
| Average points | 30.14 | 30.02 | 26.73 |
| Average grade | C | - | - |
| Average points (Best 3) | 29.83 | 31.56 | 27.73 |
| Average Grade (Best 3) | C | - | - |
| AAB or higher | 20.0% | 16.84% | 12.64% |
Discover where pupils headed after A-levels. Explore who either stayed in education or went into employment.
| Students destinations | School | LA | England |
|---|---|---|---|
| Number of students | - | 2 | 3 |
| Students staying in education | - | 24.4% | 36.26% |
| Students entering apprenticeships | - | 4.4% | 6.37% |
| Students entering employment | - | 20% | 20.03% |
| Students not in education or employment for at least two terms after study | - | 1.8% | 4.23% |
How Do We Calculate Rankings?
Our school rankings are meticulously determined through a rigorous process:
This meticulous process ensures our rankings provide accurate and meaningful insights for your school choices.
Admission
Fees
-
 £1,672 to £6,961
Yearly fee
£1,672 to £6,961
Yearly fee
-
£10,923 to £12,770
Boarding
Scholarships
Holidays & terms
Holidays 2024/25
| Holidays | Date |
|---|---|
| Autumn Half Term Holidays | 20th Oct 2025 - 31st Oct 2025 |
| Winter Holidays | 14th Dec 2025 - 5th Jan 2026 |
| Spring Half Term Holidays | 16th Feb 2026 - 23rd Feb 2026 |
| Spring Holidays | 30th Mar 2026 - 20th Apr 2026 |
| Summer Half Term Holidays | 25th May 2026 - 29th May 2026 |
| Summer Holidays | 10th Jul 2026 - 4th Sep 2026 |
Terms Dates 2024/25
| Terms | Dates |
|---|---|
| Autumn Term | 4th Sep 2025 - 17th Oct 2025 |
| Autumn Term-2 | 3rd Nov 2025 - 12th Dec 2025 |
| Spring Term | 6th Jan 2026 - 13th Feb 2026 |
| Spring Term-2 | 23rd Feb 2026 - 27th Mar 2026 |
| Summer Term | 21st Apr 2026 - 22nd May 2026 |
| Summer Term-2 | 1st Jun 2026 - 10th Jul 2026 |
Students Teachers